
Using Dataflow to stream usage & event records to a BigQuery table and visualise the results in Data Studio
Before each device is able to send data to the application it needs to communicate with the mobile network to ensure that the data is allowed to be sent over the network. The EMnify DataStreamer makes connectivity metadata available in real-time to your cloud platform for detailed insights on the event and usage data of your devices.
Prerequisites
This article requires a running data stream integration from EMnify to Pub/Sub as described in our Pub/Sub integration guide. After following the guide, the following resources should be in your account:
- A GCP project containing a Pub/Sub topic emnify-device-usage-data with usage data successfully being published.
- A GCP project containing a Pub/Sub topic emnify-device-event-data with event data successfully being published.
Benefits
- connectivity metadata integrated into operational dashboards for service teams
- allows faster triaging between device, connectivity and application issues
- insights about network attach, data and roaming issues or when device is above service limit
- view on service usage and cost per device
- directly delivered to Google Cloud without need for managing application servers
- Powerful Dashboards in Google Data Studio:
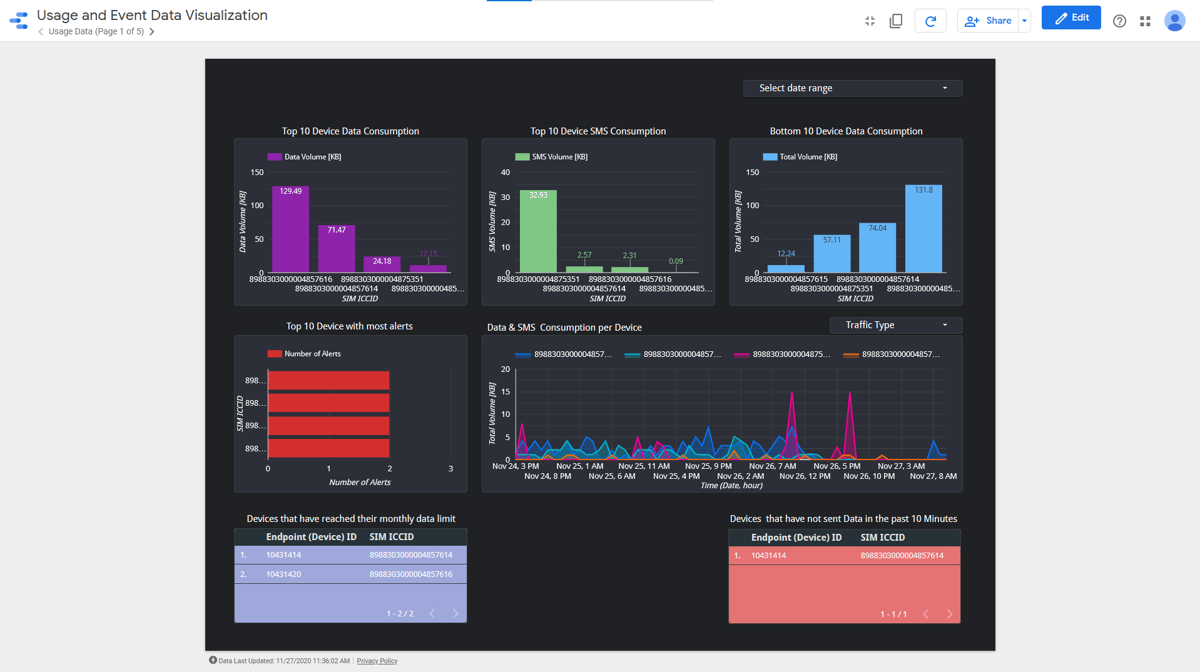
- displaying Top 10 most data consuming devices
- showing device alerts
- listing devices that have not sent data in the past 10 minutes that previously sent data in the past hour
Content
Configuring via gcloud SDK for Usage Data
For users who already use the gcloud SDK, setting up the temporary storage, creating a new BigQuery dataset and running the Dataflow job can be done directly from the CLI in the following steps. The following three parameters must be replaced with your project settings:
- my_gcp_project - the ID of your GCP project
- my_temp_bucket - a name for a temporary bucket used for the dataflow job, you are not allowed to create a bucket with a name already in use by another user.
# Create bucket
gsutil mb -p my_gcp_project gs://my_temp_bucket
touch placeholder && gsutil cp placeholder gs://my_temp_bucket/bigquery_tmp/

# Create Dataset with usage data schema
bq --location=europe-west3 mk -d emnify_usage_data
curl https://gist.githubusercontent.com/bsmth/b3e08d046f315fb186d08d81cb19427e/raw/489768a54a6b5bd48f370844da4eb364e3e02693/usagedata.json > ./usagedataschema.json
bq mk --table emnify_usage_data.usage_records ./usagedataschema.json

# Create Dataflow Job
gcloud dataflow jobs run ps_to_bigquery_dataflow \
  --gcs-location gs://dataflow-templates-us-central1/latest/PubSub_to_BigQuery \
  --region europe-west3 --staging-location gs://my_temp_bucket/bigquery_tmp \
  --parameters inputTopic=projects/my_gcp_project/topics/emnify-device-data,outputTableSpec=my_gcp_project:emnify_usage_data.usage_records
Setup via Google Cloud Console for Usage Data
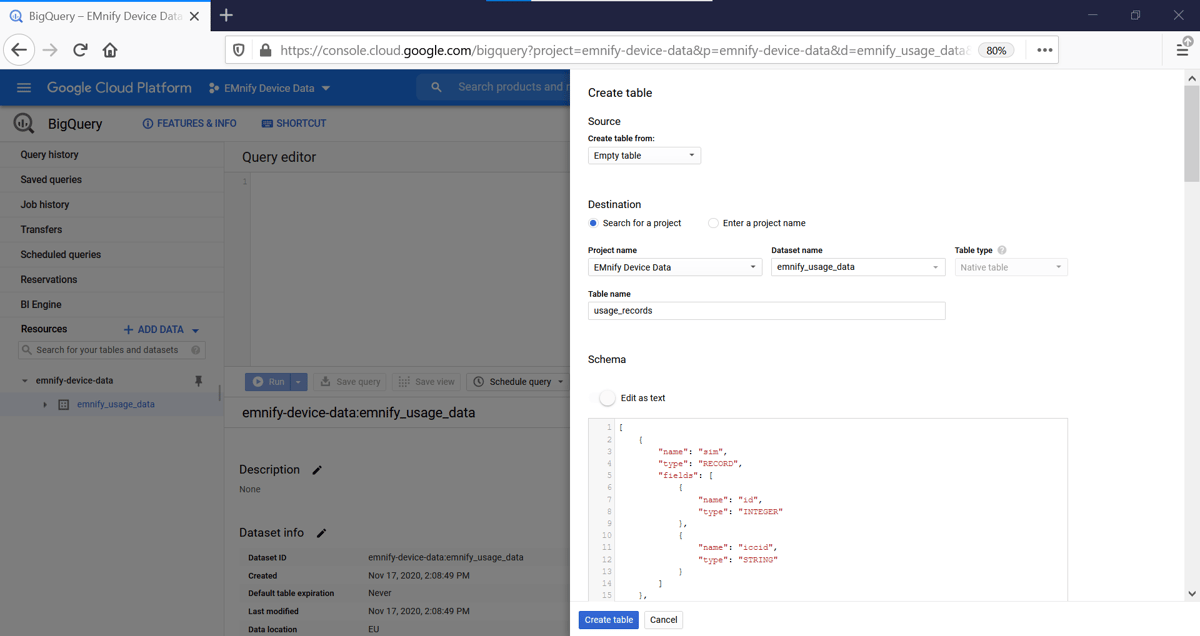
The first step is to create a table in BigQuery for incoming usage data. In the Google Cloud console:
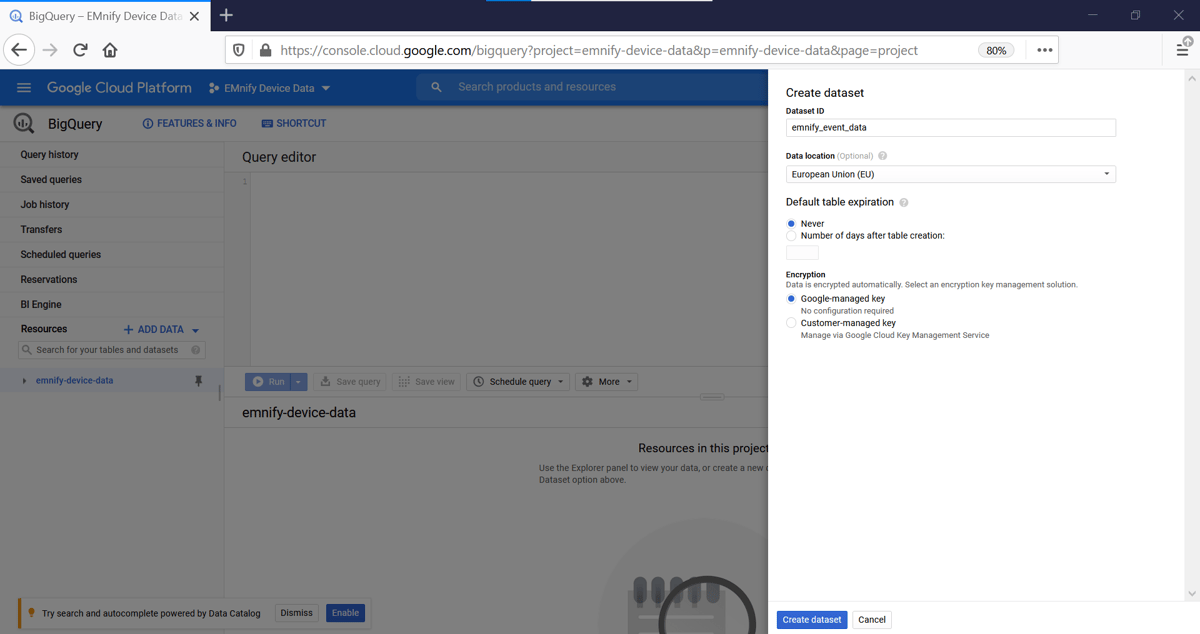
- Navigate to BigQuery and click + Create Dataset
- Give the dataset a name, this example uses emnify_usage_data
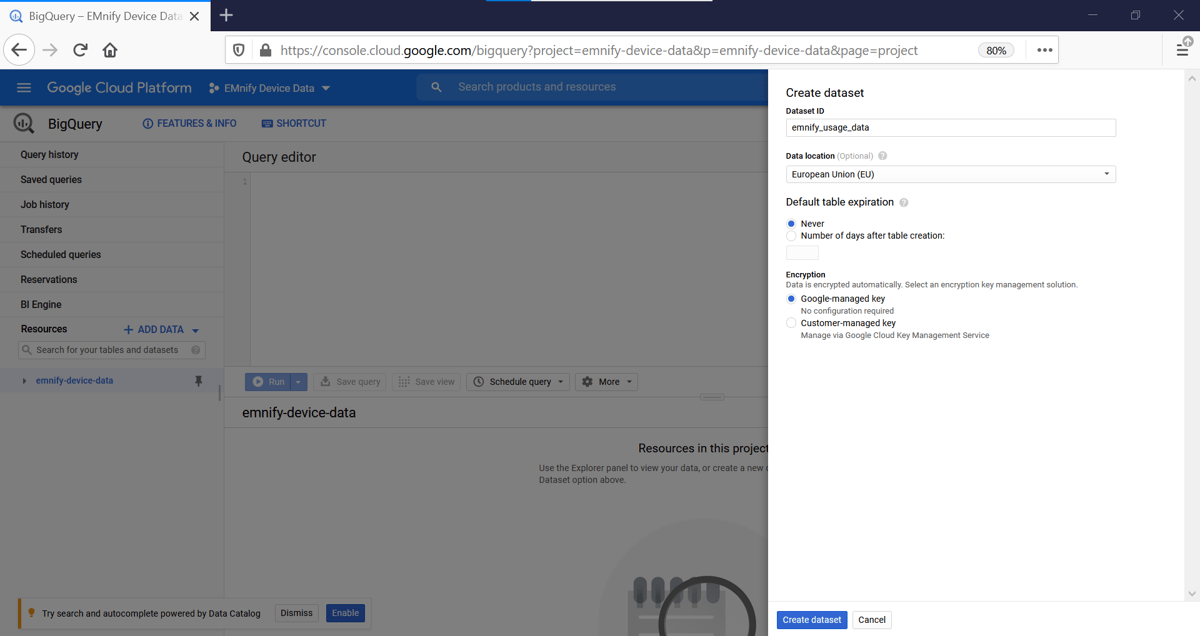
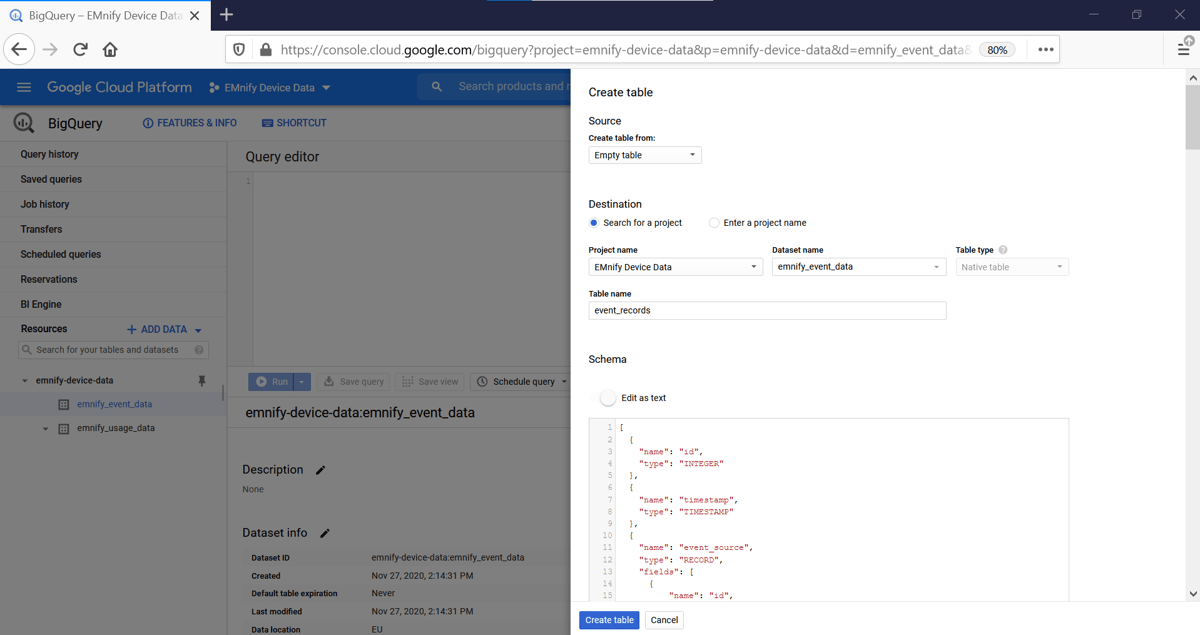
- With the new dataset selected, click +Create Table and give it the name usage_records
- For the schema, click edit as text and paste the following JSON schema description
Creating a Dataflow Job
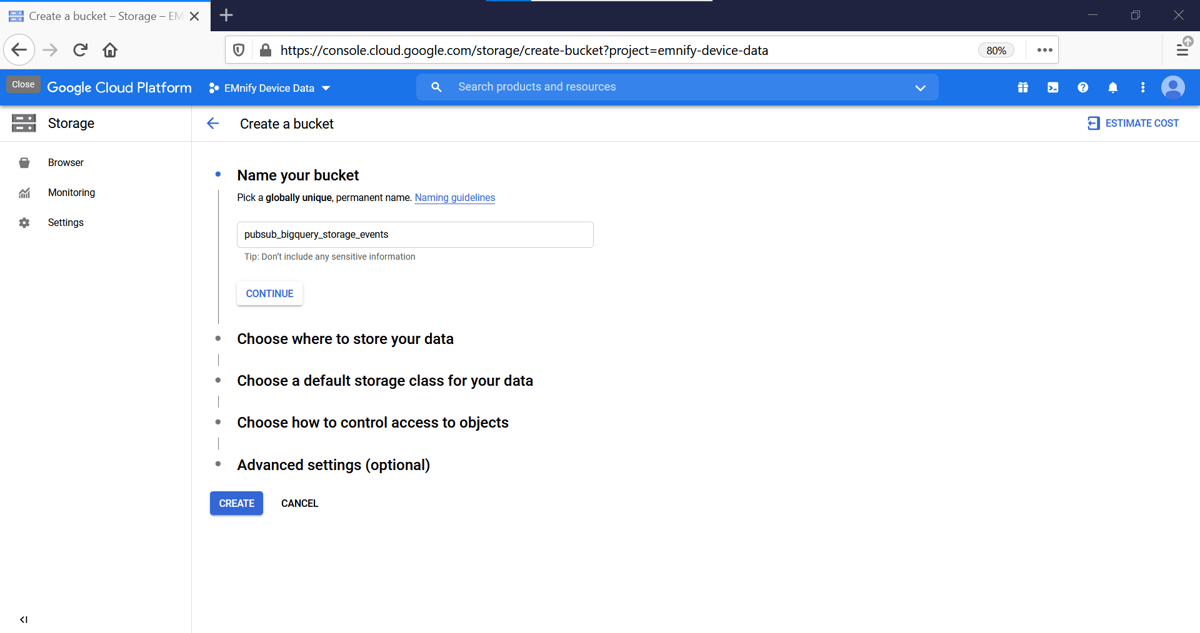
In order to extract data from the Pub/Sub topic into our BigQuery dataset, we will use a Dataflow job which will run each time new messages arrive into the Pub/Sub topic. The Dataflow job uses a storage container for temporary files during the ETL job. Cloud Storage has a single namespace, so you are not allowed to create a bucket with a name already in use by another user. This example uses pubsub_bigquery_storage_events but a different bucket name should be chosen for your dataflow job.
- Navigate to Storage and create a new bucket and select a region
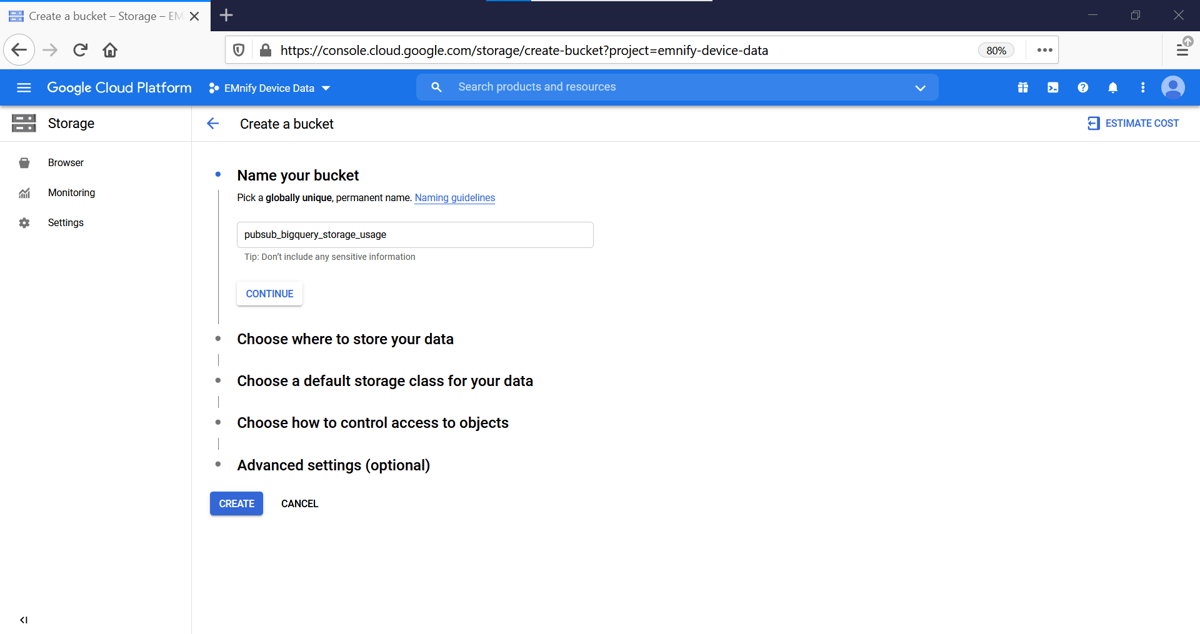
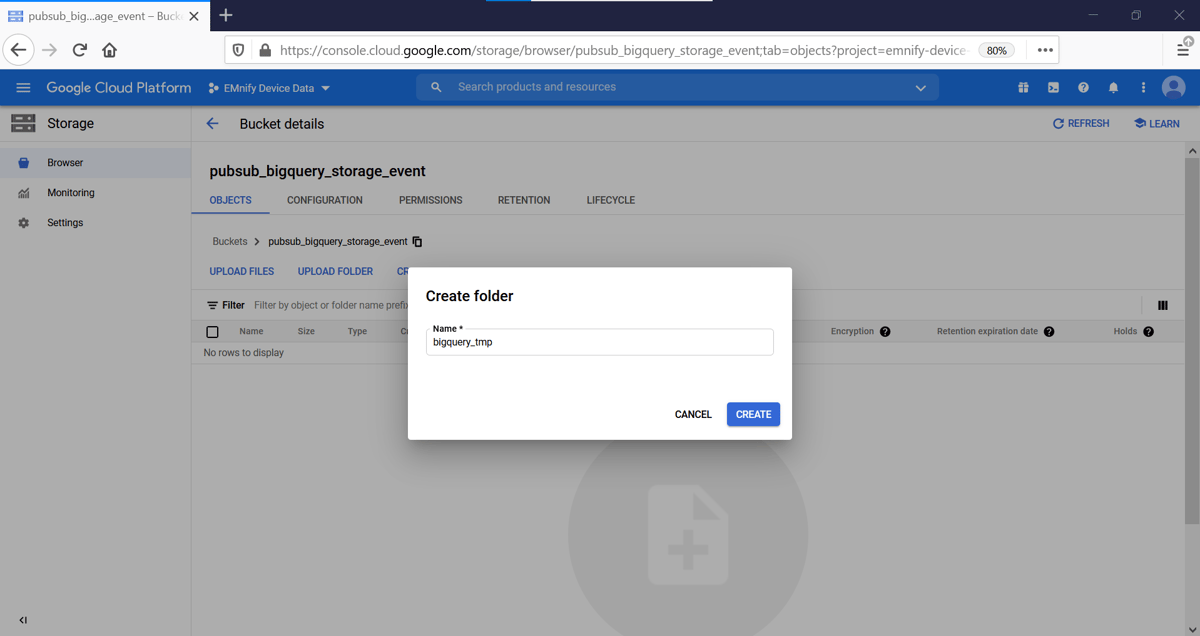
- Create a directory in the bucket for the Dataflow job, this example uses the folder bigquery_tmp

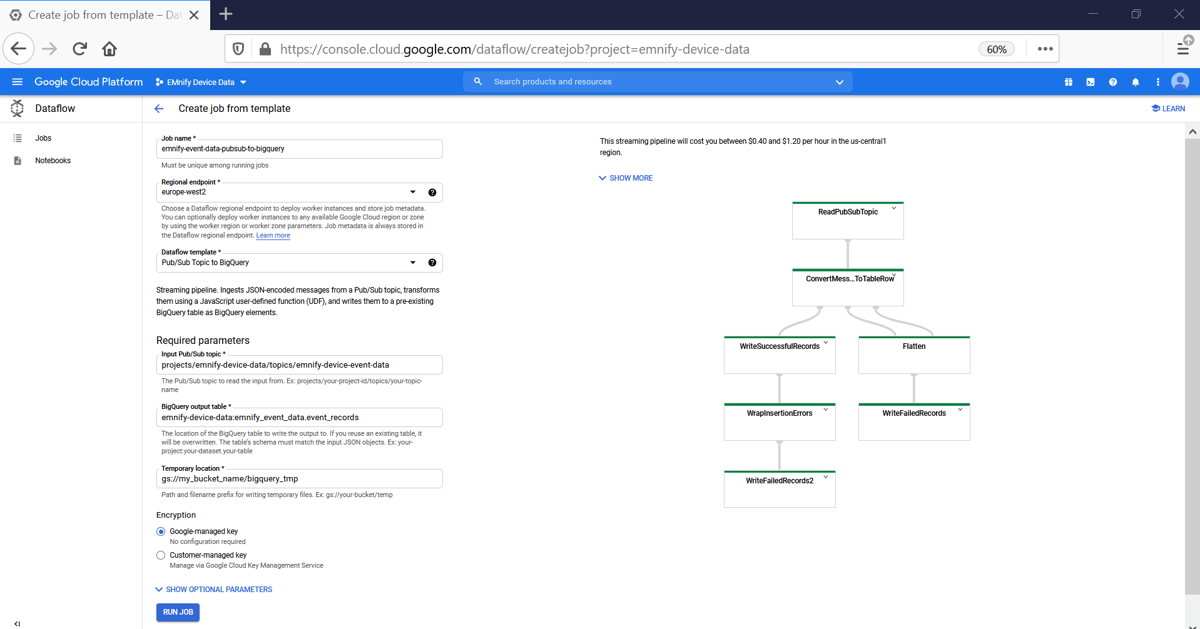
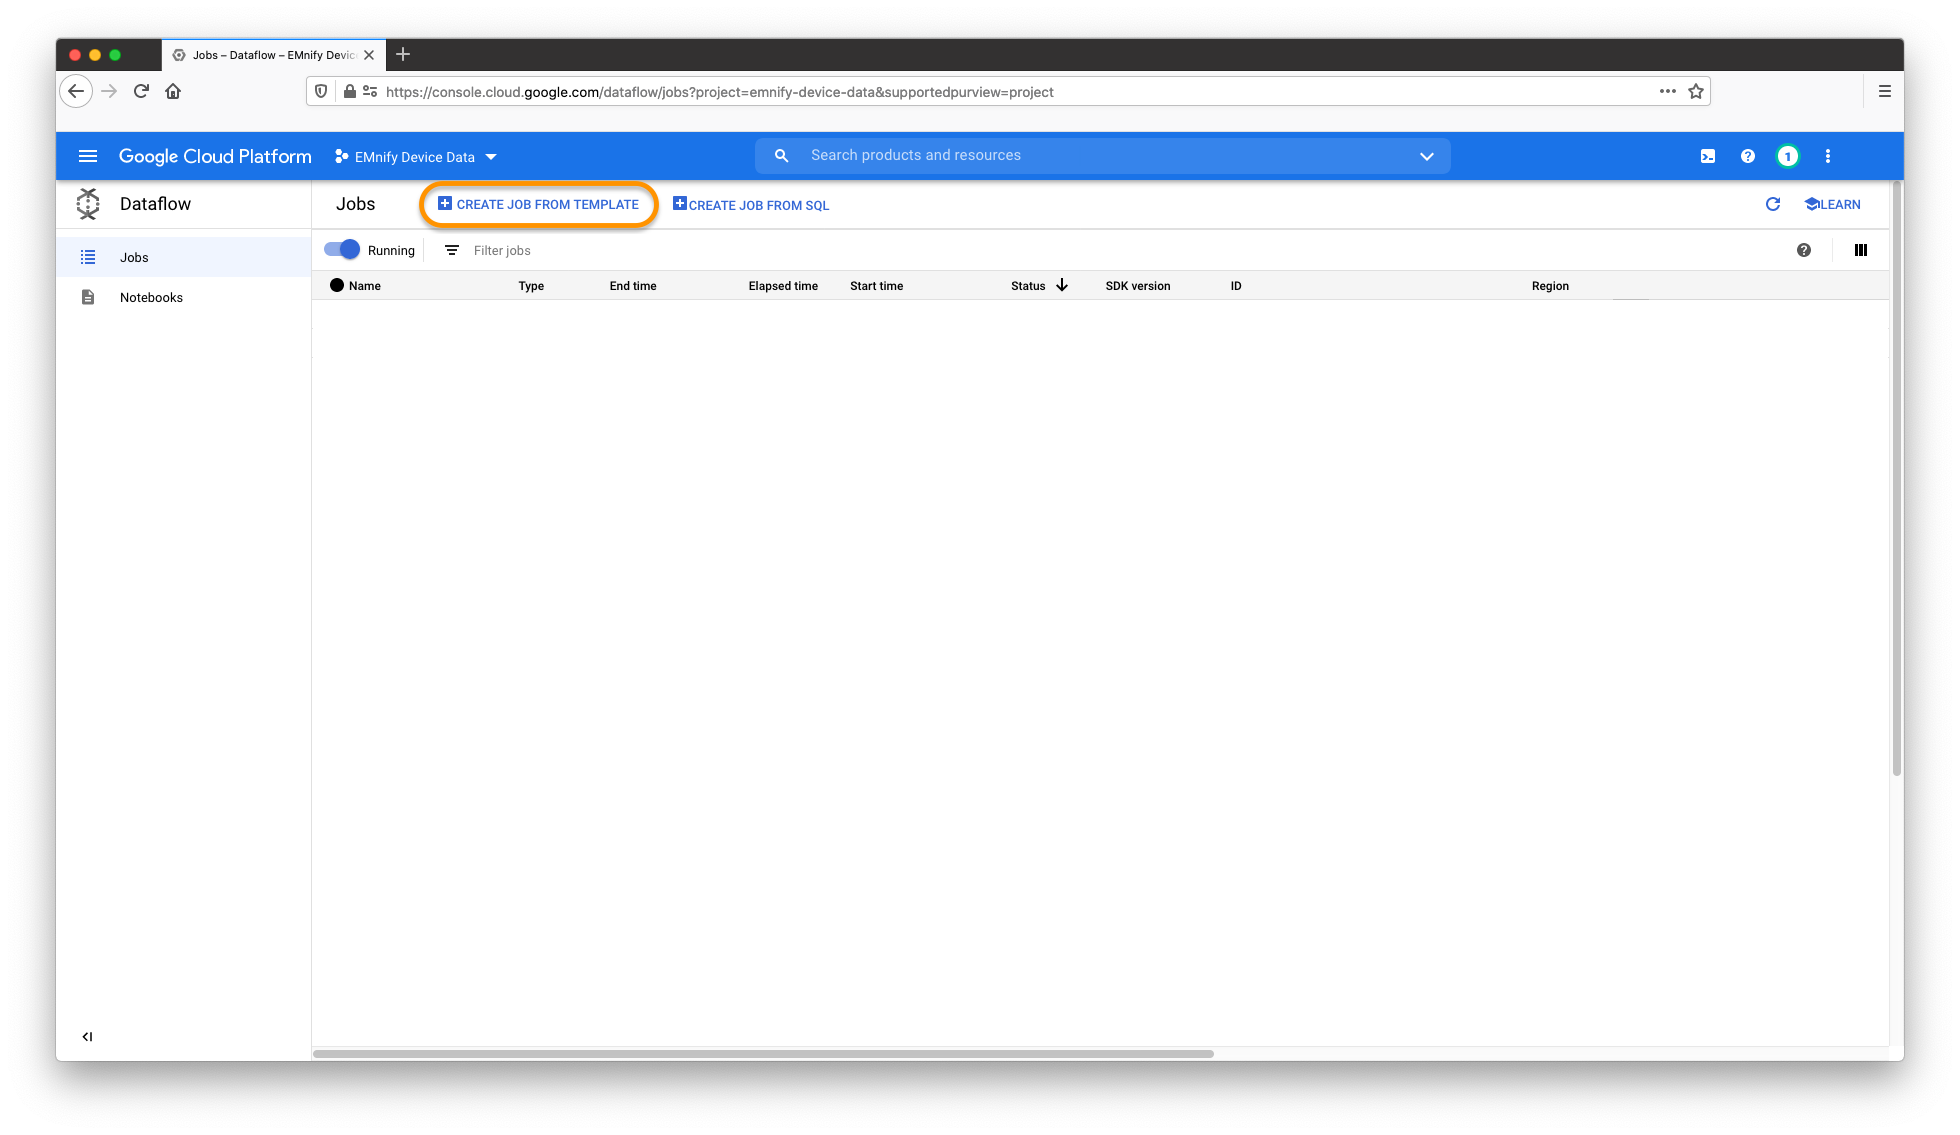
- Navigate to Dataflow and click Create Job from Template
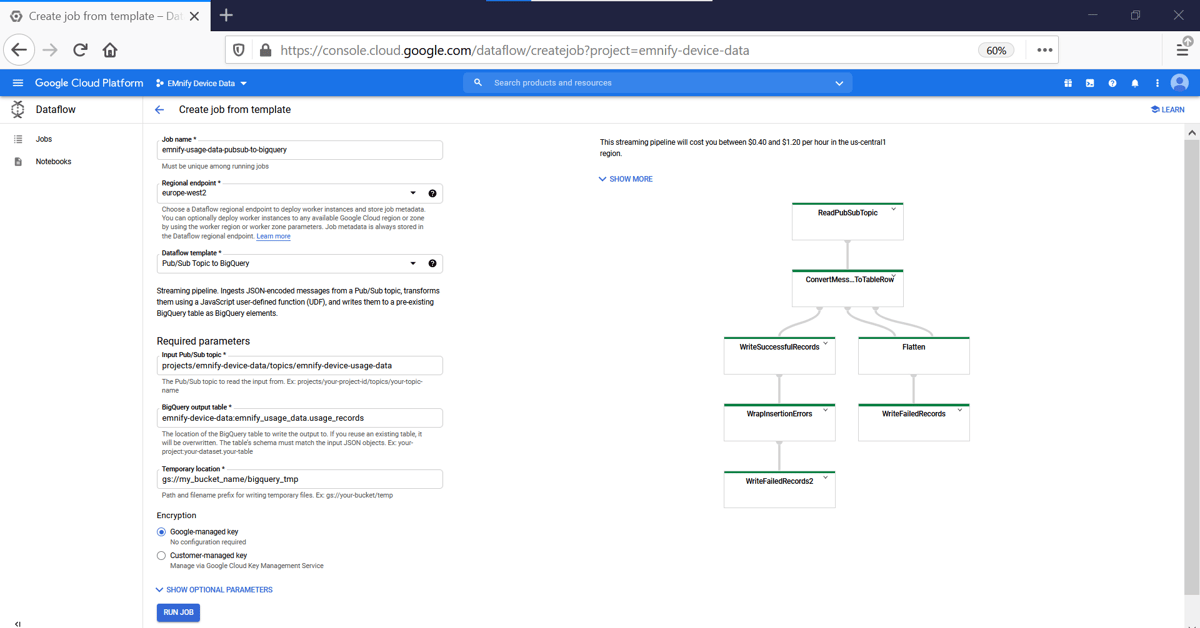
- In the Dataflow job give it a suitable name and region and set the following parameters:
- Dataflow template: Pub/Sub Topic to BigQuery
- Input Pub/Sub topic: projects/my_project_name/topics/
emnify-device-data - BigQuery output table: my_project_name:emnify_usage_data.usage_records
- Temporary location: gs://my_bucket_name/bigquery_tmp
Verifying the integration
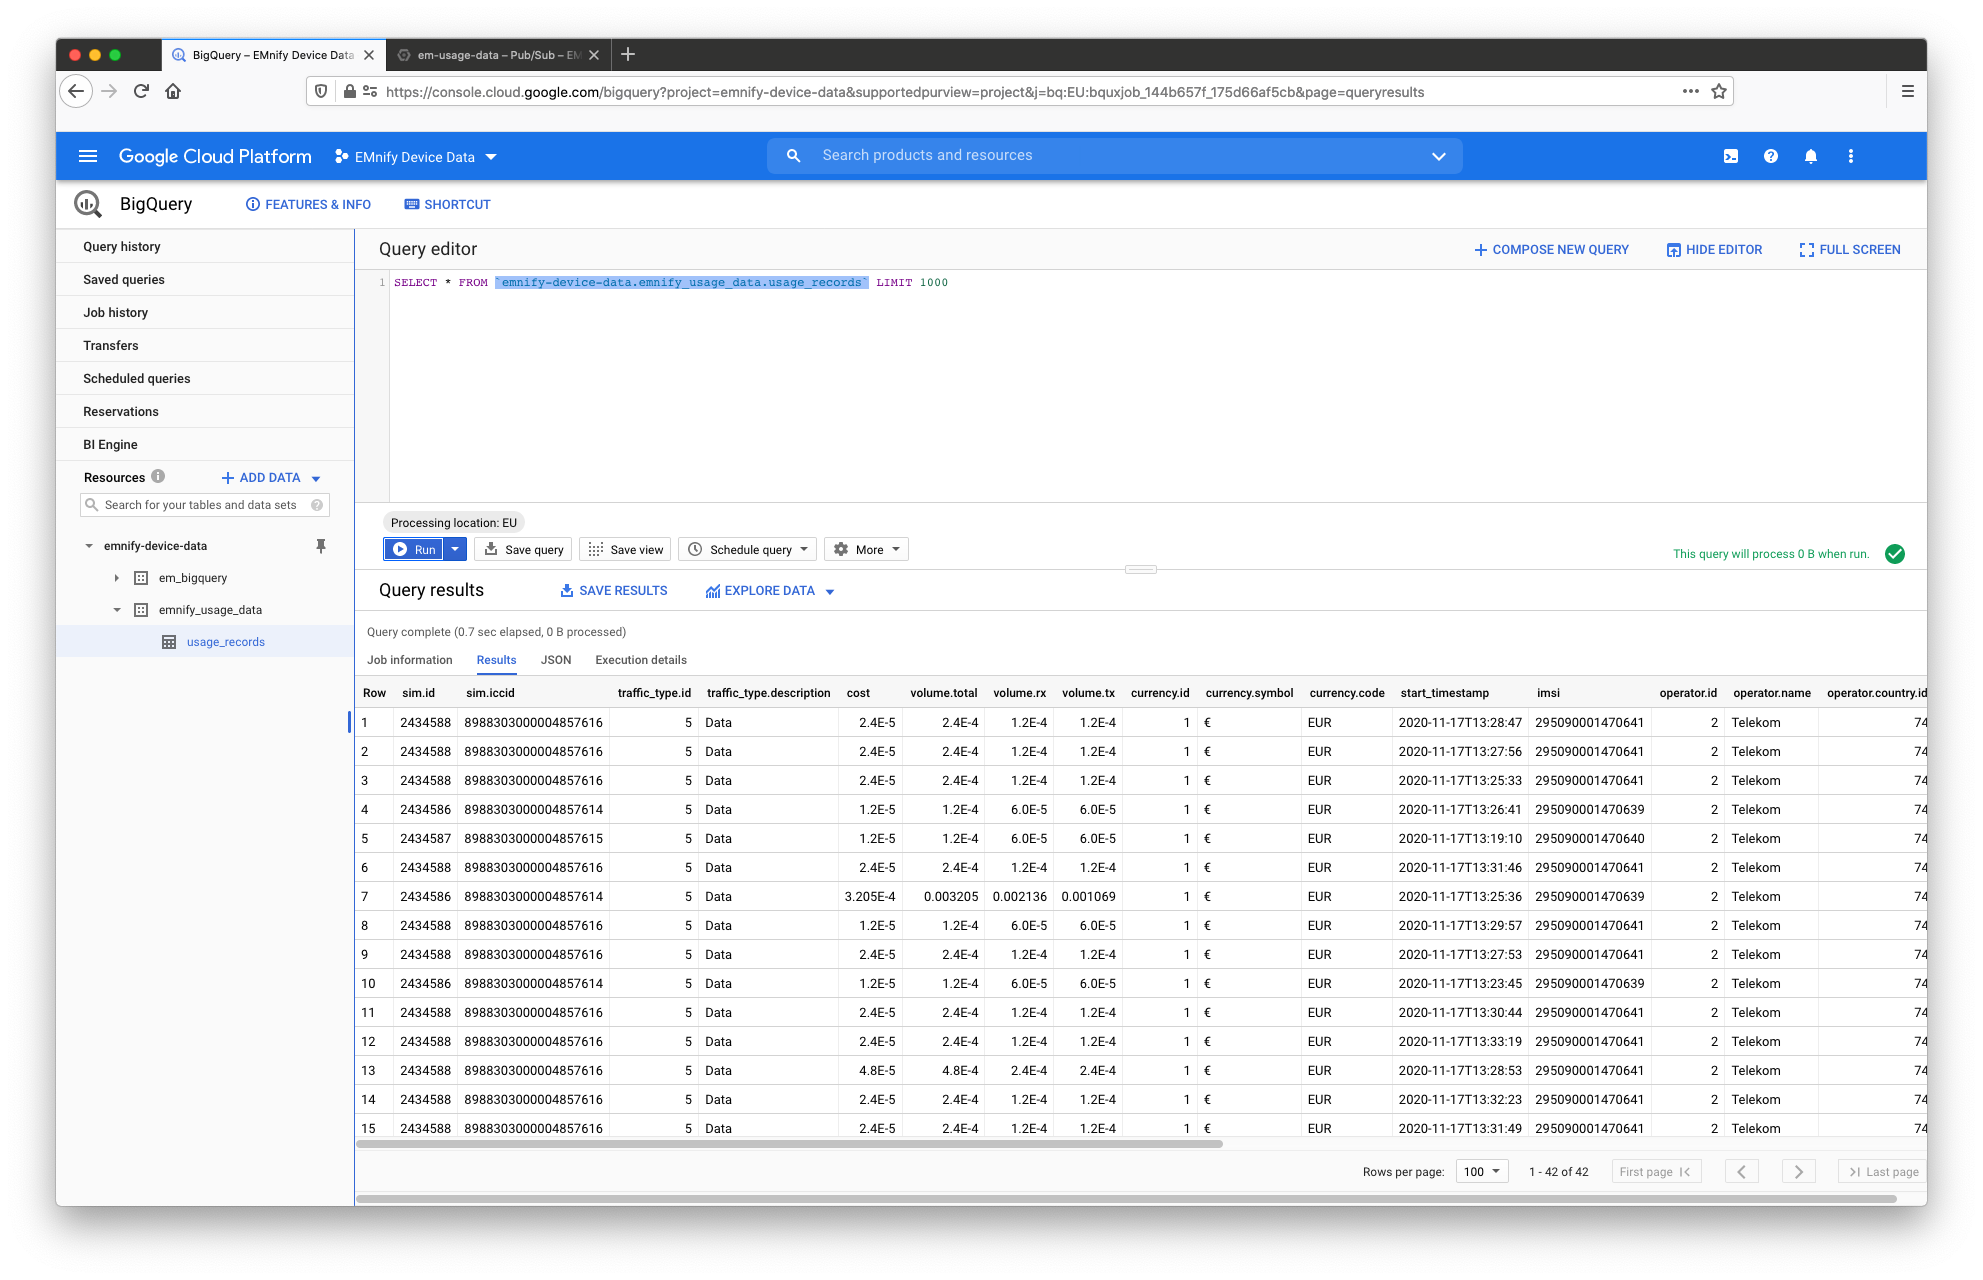
Navigating back to BigQuery will show some records being written to usage_records in the details tab of the table. The table can be explored by clicking on Query Table showing the latest usage records arriving from the Pub/Sub topic.
Configuring via gcloud SDK for Event Data
For users who already use the gcloud SDK, setting up the temporary storage, creating a new BigQuery dataset and running the Dataflow job can be done directly from the CLI in the following steps. The following three parameters must be replaced with your project settings:
- my_gcp_project - the ID of your GCP project
- my_temp_bucket - a name for a temporary bucket used for the dataflow job, you are not allowed to create a bucket with a name already in use by another user.
# Create bucket
gsutil mb -p my_gcp_project gs://my_temp_bucket
touch placeholder && gsutil cp placeholder gs://my_temp_bucket/bigquery_tmp/

# Create Dataset with event data schema
bq --location=europe-west3 mk -d emnify_event_data

curl https://gist.githubusercontent.com/bsmth/b6ee528129321c4bcec2e25478f89cae/raw/c3412ec3ffddff0bb70376f6e3d24556180da0a8/event_data.json > ./eventdataschema.json
bq mk --table emnify_usage_data.usage_records ./eventdataschema.json

# Create Dataflow Job
gcloud dataflow jobs run ps_to_bigquery_dataflow \
--gcs-location gs://dataflow-templates-us-central1/latest/PubSub_to_BigQuery \
--region europe-west3 --staging-location gs://my_temp_bucket/bigquery_tmp \
--parameters inputTopic=projects/my_gcp_project/topics/emnify-device-data,outputTableSpec=my_gcp_project:emnify_event_data.event_records
Setup via Google Cloud Console for Event Data
The first step is to create a table in BigQuery for incoming usage data. In the Google Cloud console:
- Navigate to BigQuery and click + Create Dataset
- Give the dataset a name, this example uses emnify_event_data
- With the new dataset selected, click +Create Table and give it the name event_records
- For the schema, click edit as text and paste the following JSON schema description
Creating a Dataflow Job
In order to extract data from the Pub/Sub topic into our BigQuery dataset, we will use a Dataflow job which will run each time new messages arrive into the Pub/Sub topic. The Dataflow job uses a storage container for temporary files during the ETL job. Cloud Storage has a single namespace, so you are not allowed to create a bucket with a name already in use by another user. This example uses pubsub_bigquery_storage but a different bucket name should be chosen for your dataflow job.
- Navigate to Storage and create a new bucket and select a region
- Create a directory in the bucket for the Dataflow job, this example uses the folder bigquery_tmp
- Navigate to Dataflow and click Create Job from Template
- In the Dataflow job give it a suitable name and region and set the following parameters:
- Dataflow template: Pub/Sub Topic to BigQuery
- Input Pub/Sub topic: projects/my_project_name/topics/
emnify-device-event-data - BigQuery output table: my_project_name:emnify_event_data.event_records
- Temporary location: gs://my_bucket_name/bigquery_tmp
Verifying the integration
Navigating back to BigQuery will show some records being written to event_records in the details tab of the table. The table can be explored by clicking on Query Table showing the latest usage records arriving from the Pub/Sub topic.
Building a Dashboard in Data Studio
Within Data Studio, the usage and event records can be used to visualise data consumption per device and show devices that have not sent data in the past 10 minutes despite sending data in the last hour.
Navigate to Data Studio and click Blank Report.
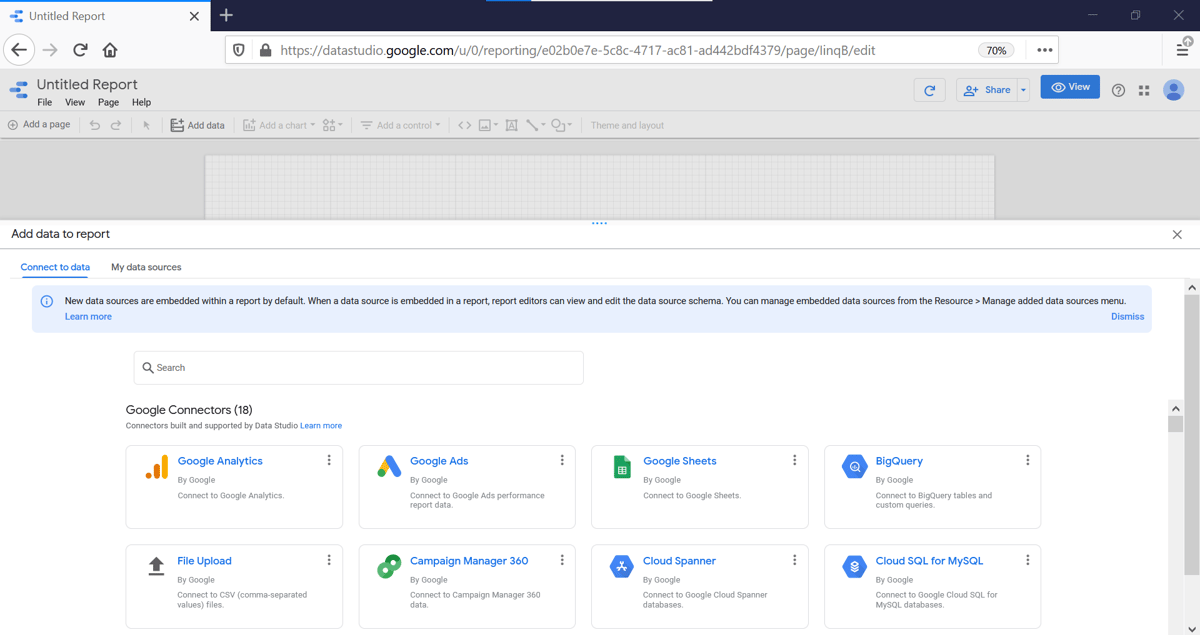
In the Untitled Report, click on Add Data and select BigQuery:
Select your GPC Project, Dataset (in this example emnify_event_data) and Table (here event_records), then click Add
Repeat the Steps above to add the usage_records Table from the emnify_usage_data Dataset to your Data Studio Report.
Give your Report a Name, for example EMnify Device Data.
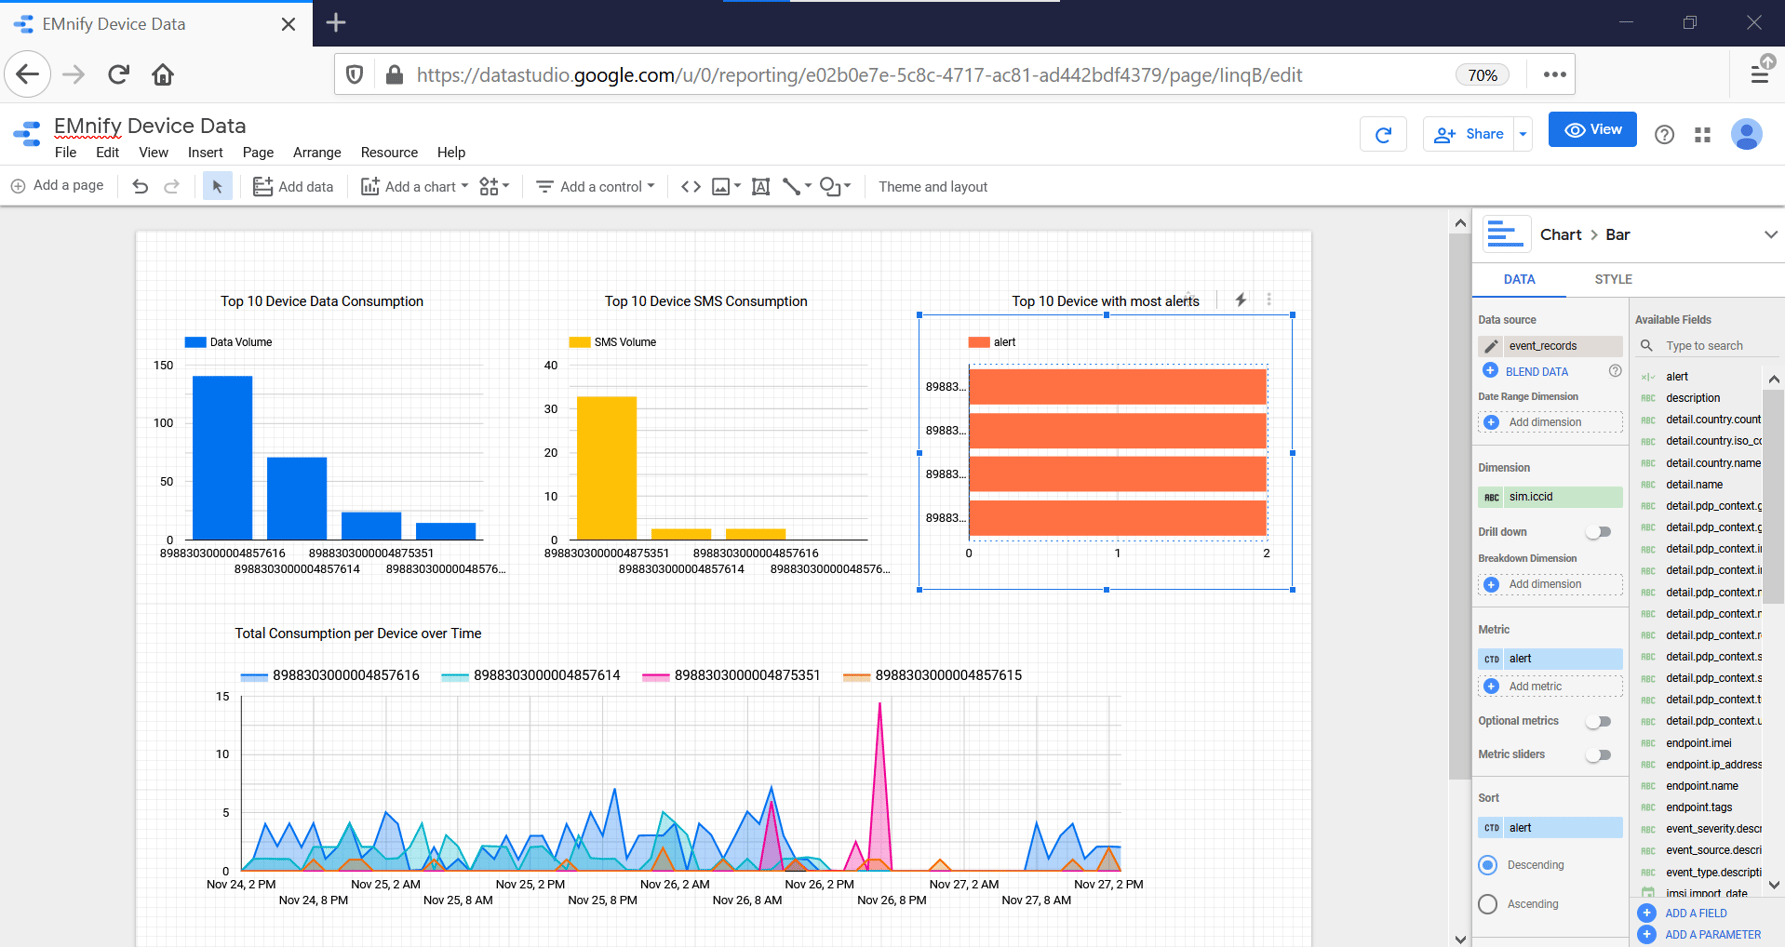
Top 10 Device Data & SMS Consumption
To create Graphs displaying the Top 10 devices with highest Data or SMS consumption:
- Click on Add a Chart and under Bar select Column Chart.
Important: The Data Source of the graph must be usage_records.
If event_records is selected, simply delete it and click Select Data Source and choose usage_records. - To display Top 10 device data consumption, click on the newly created Column Chart and set the following parameters:
- end_timestamp as the Date Range Dimension with type Date, Hour to have hourly granularity (click on the
 symbol to edit the Type)
 - sim_iccid in the Dimension field
- volume.rx in sum format under the Metric field
- under the STYLE tab, set Bars to 10 to only display the top 10 devices.
- By double clicking on the
 next to each previously set variable, you may change the displayed name of the variable, i.e. change "volume.rx" to "Data Volume"
 - Click the textbox icon
 to add a Title to the Graph: " Top 10 Device Data Consumption"
- end_timestamp as the Date Range Dimension with type Date, Hour to have hourly granularity (click on the
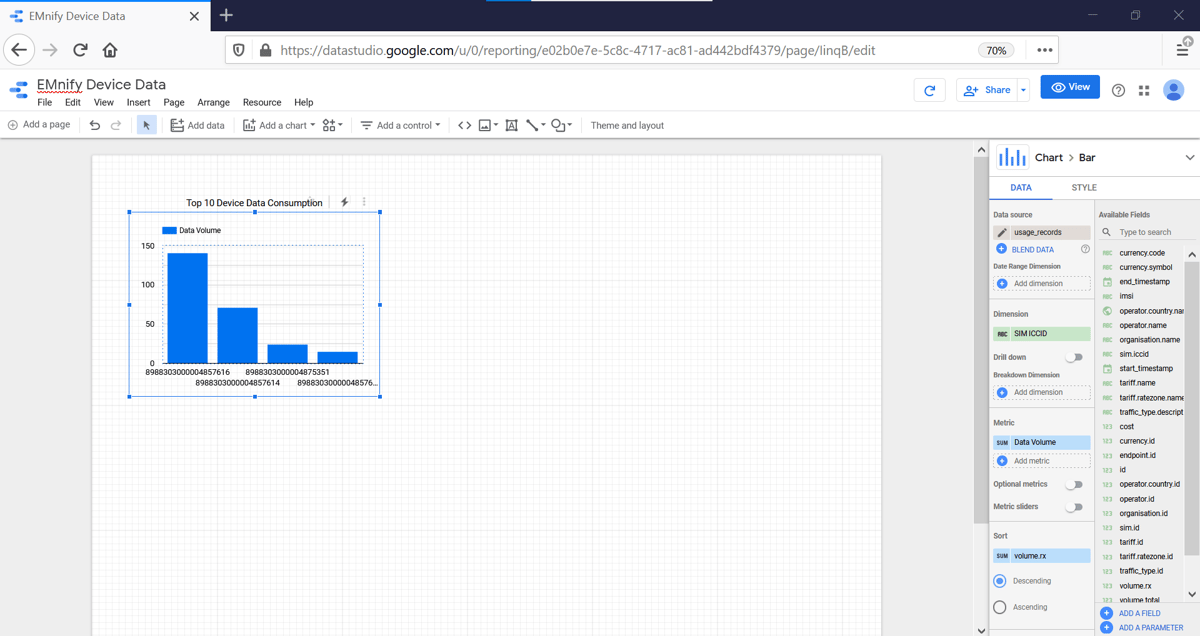
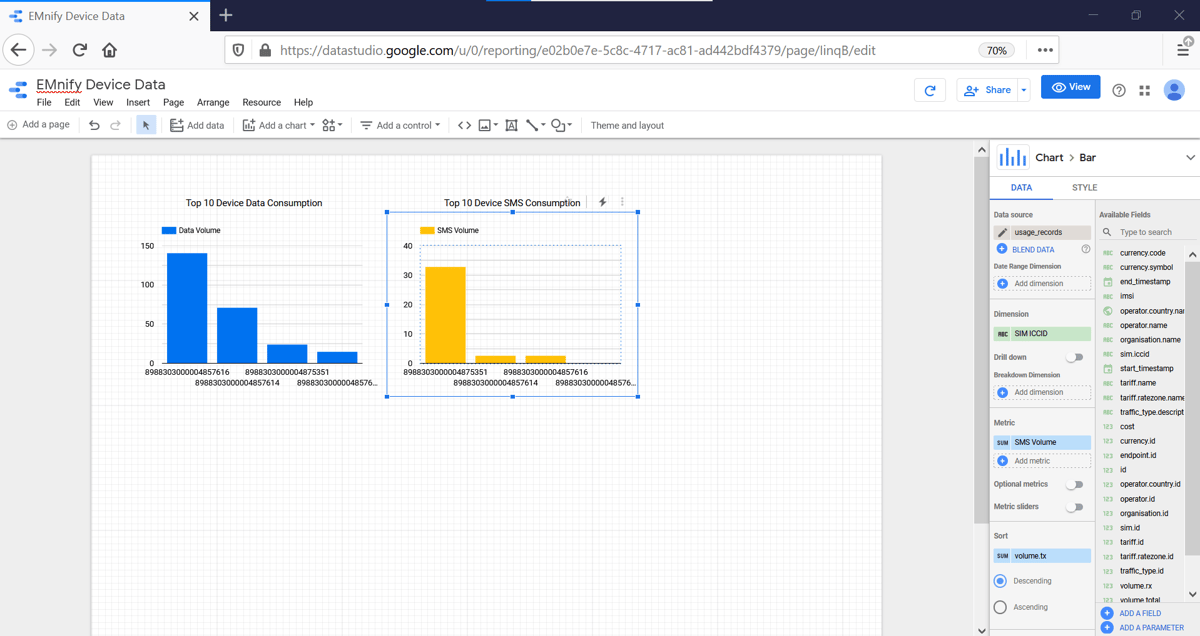
- Copy and Paste the Column Chart. Select the Copy and change the Metric to volume.tx
- Add another textbox as a title for the new Graph: "Top 10 Device SMS Consumption"
Total consumption per Device over Time
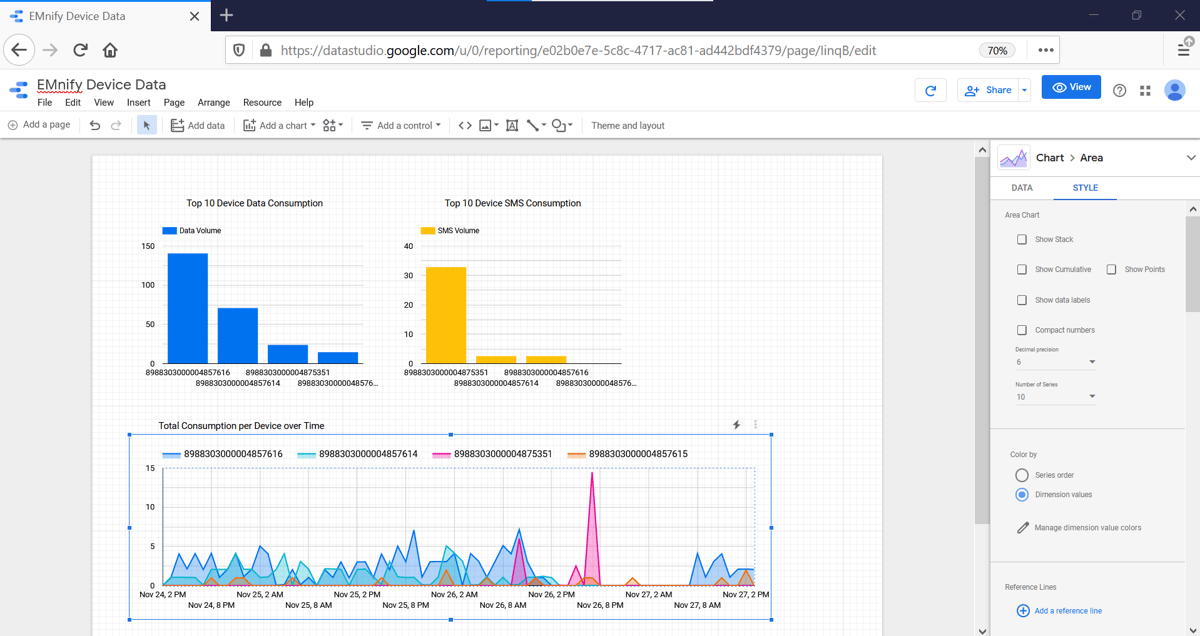
To create a graph displaying the data consumption per device over a period of time:
- Click on Add a chart and select Area Chart
Important: The Data Source of the graph must be usage_records.
If event_records is selected, simply delete it and click Select Data Source and choose usage_records. - Select the following parameters:
- end_timestamp as the Date Range Dimension with type Date, Hour to have hourly granularity (click on the
 symbol to edit the Type)
 - end_timestamp as the Dimension with type Date, Hour
- sim_iccid as the Breakdown Dimension
- volume.total in the Metric field
- end_timestamp as the Date Range Dimension with type Date, Hour to have hourly granularity (click on the
In order to limit to a Top N count of devices, the style panel can limit the number of series lines drawn. In the Style panel
- Set number of Series to 3 to view top 3 devices
- Set Decimal precision to 6 places as the volume metrics (total, rx, and tx) are delivered in MB with 6 decimal places
Devices with most Alerts
To create a graph displaying the number of alerts per device:
- Click on Add a chart and select Bar Chart
Important: The Data Source of the graph must be event_records.
If usage_records is selected, simply delete it and click Select Data Source and choose event_records. - Select the following parameters:
- sim_iccid as the Dimension
-
- alerts in the Metric field
Devices that have reached their monthly data limit
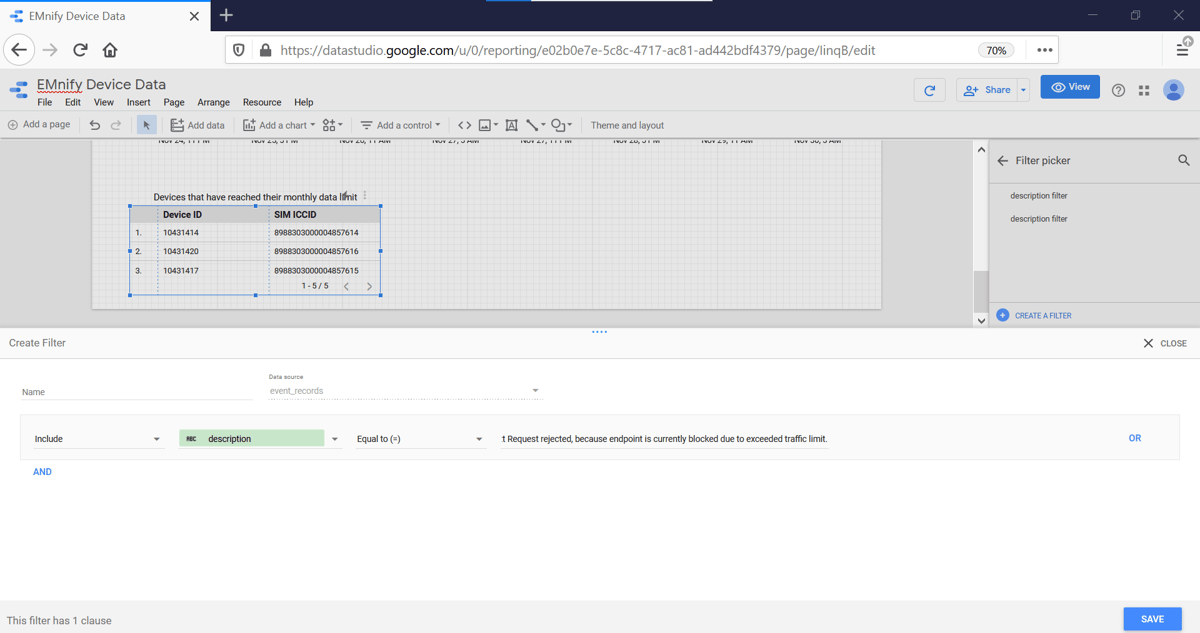
To create a table displaying the devices that have reached their monthly data limit:
- Click on Add a chart and select Table
Important: The Data Source of the graph must be event_records.
If usage_records is selected, simply delete it and click Select Data Source and choose event_records. - Select the following parameters:
- timestamp as the Date Range Dimension with type Date, Hour to have hourly granularity (click on the
 symbol to edit the Type)
 - endpoint.id as the Dimension, rename it to Device ID
- sim_iccid as another Dimension, rename it to SIM ICCID
- timestamp as the Date Range Dimension with type Date, Hour to have hourly granularity (click on the
- Scroll down the DATA column and click Add Filter. In the new panel:
- select description as a field
- select Equal to (=) as the condition
- paste the following into the "example:value" field: PDP Context Request rejected, because endpoint is currently blocked due to exceeded traffic limit.
- click save
Devices that have not sent Data in the past 10 Minutes
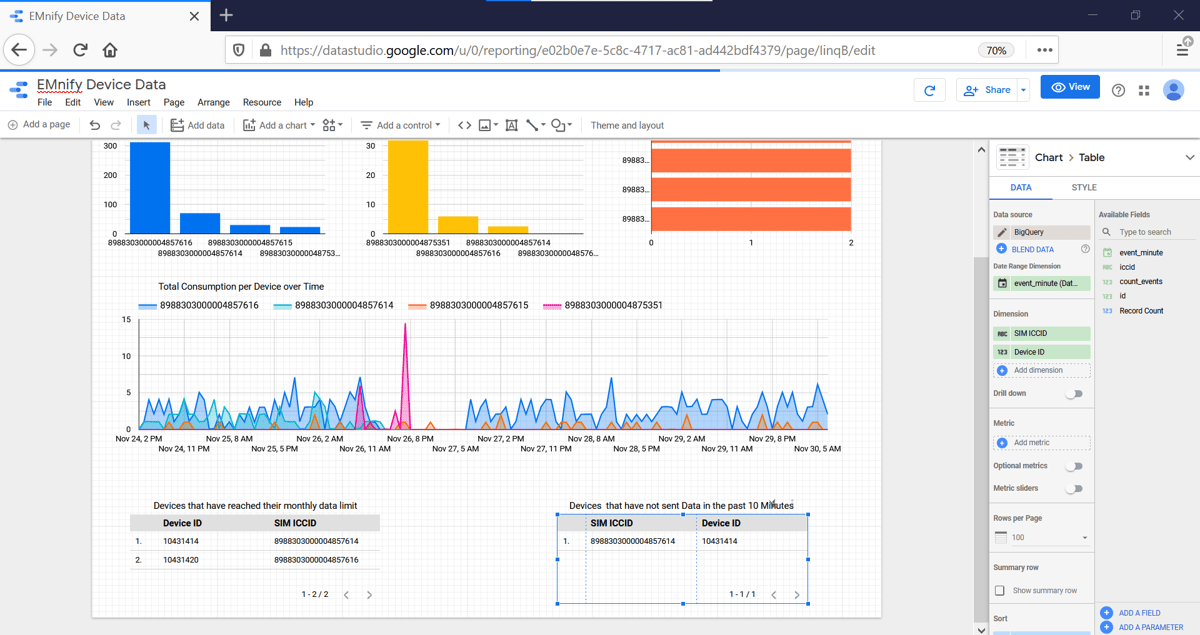
It might happen that your device is active but does not send data for an unknown reason. This will not trigger any events, but can be shown by looking at which devices sent data in a past timeframe and which of these have not sent data very recently.
To create a table listing the number of devices that have sent data in the past hour but not in the last 10 minutes, the data from BigQuery must be imported to Data Studio using a custom Query.
- Click on Add Data and select BigQuery
- on the left side click on Custom Query and select the correct Project
- paste the following SQL code into the provided field:
SELECT
EXTRACT(DATETIME FROM timestamp AT TIME ZONE "UTC") AS event_minute,
endpoint.id, sim.iccid,
count(event_type.id) as count_events
FROM `emnify_event_data.event_records`
WHERE endpoint.id NOT IN (
SELECT DISTINCT(endpoint.id)
FROM `emnify_event_data.event_records`
WHERE timestamp > TIMESTAMP_SUB(CURRENT_TIMESTAMP(), INTERVAL 10 MINUTE)
AND detail.volume.total > 0 )
AND timestamp > TIMESTAMP_SUB(CURRENT_TIMESTAMP(), INTERVAL 60 MINUTE)
group by 1,2,3
order by event_minute DESC - click Add
- To create the table displaying the devices that have sent data in the past 60 minutes but not in the past 10 minutes:
- Click on Add a chart and select Table
- The Data Source for this table must be BigQuery, which is the custom queried source previously created.
- select event_minute as the Date Range Dimension
- select id (from the Endpoint) and iccid as the two Dimensions, rename to Device ID and SIM ICCID respectively.

The content team of emnify is specialized in all things IoT. Feel free to reach out to us if you have any question.
