At EMnify, we run a custom-built mobile core network tailored to provide connectivity for IoT devices. By developing all the required parts in-house, we can offer unique features that would not be available using network equipment from traditional vendors. We use Akka, a framework for building highly scalable applications in Java, to implement this functionality.
In the following blog post, we will explain how to export application metrics out of a distributed Akka application using the brand-new Kamon 1.0.
Kamon Overview
Kamon is an open source monitoring framework for applications running on the Java Virtual Machine (JVM) with integrations for Scala and Akka. After 5 years of extensive refactorings, it was the right time for the development team to release a more mature and advanced version of their software.
Kamon 1.0's features can be divided into two groups: tracing and metrics:
- Metrics: counters, rates and histograms reflecting values such as request rates, function calls, latencies, and more. For storing such time-series, we at EMnify recommend Prometheus, on which we focus in this article.
- Tracing collects execution details about a request's journey through an actor system, even spanning over different nodes in an Akka cluster. Kamon can export traces to Jaeger and Zipkin. More details about Kamon's tracing capabilities can be found in the 1.0 announcement.
A full list of modules can be found on bintray.com and in the GitHub organisation kamon-io.
In this article, we explain how to set up Kamon with Prometheus. We will define custom metrics that can be implemented by us developers to track application metric. In the second article (stay tuned), we will explain how to use kamon-akka, which provides us information about our actor system, i.e., mailbox sizes, processing times etc.
Setting up Prometheus
To store the metrics collected by Kamon, you will need to set up Prometheus and expose metrics from the inside of our application using kamon-prometheus. The following diagram illustrates the setup, assuming everything will happen on your local machine:
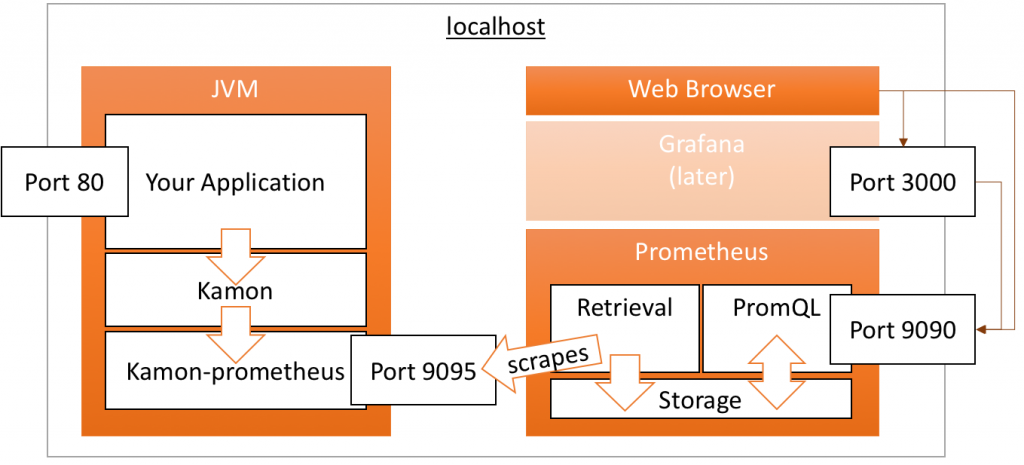 Kamon + Prometheus on localhost
Prometheus is fairly easy to set up. After downloading it, you only need to adjust its configuration file prometheus.yml.
To scrape (Prometheus' term for monitor) a certain target, it needs to be added to the scrape_configs section. For an application running kamon-prometheus on your machine, define the following configuration and make sure that the scrape_interval matches your configured kamon.metric.tick-interval. Otherwise, you will later get chainsaw graphs.
global:

 scrape_interval: 60s # By default, scrape targets every 60 seconds.

 scrape_configs:

 - job_name: prometheus

 static_configs:

 - targets: ['localhost:9050']

 - job_name: kamon

 static_configs:

 - targets: ['localhost:9095']
While the first job prometheus instructs Prometheus to monitor itself, the kamon job scrapes the metrics collected by kamon-prometheus.
But you first need to expose it on http://localhost:9095. Therefore, we will start with by adding the dependencies:
- Add the kamon-io/releases repo. The required Maven config can be accessed on bintray using the blue "SET ME UP!" button.
- Add the dependencies to kamon-core and kamon-prometheus, both in version 1.0.0 at the time of writing.
You can enable particular reporters either hardcoded in the code (see docs) or via the application's configuration file:
- Add the following line to your application startup code:
Kamon.loadReportersFromConfig();
- Configure the PrometheusReporter by specifying:
kamon.reporters = [kamon.prometheus.PrometheusReporter]
After starting the application, http://localhost:9095 should emit the following message for at least a few seconds:
# The kamon-prometheus module didn't receive any data just yet.
After a few seconds, when the first "tick" of metrics collection happened, this message will disappear - and the page should be all white.
Validating the Setup
Kamon features no metrics by default, thus we get the empty output. Let's go ahead and add one, by adding the following line:
Kamon.counter("hello.kamon").increment();
The result on port 9095 should be:
# TYPE hello_kamon_total counter
hello_kamon_total 1.0
Our metric name hello.kamon is automatically converted to Prometheus format (underscores) and conventions (_total suffix for counters). Well done, Kamon! If it takes too long until metrics become visible, you can set kamon.metric.tick-interval = 5 seconds.
Once you start and open up Prometheus (on http://localhost:9090), you should be able to query the metric by specifying the following expression: hello_kamon_total.
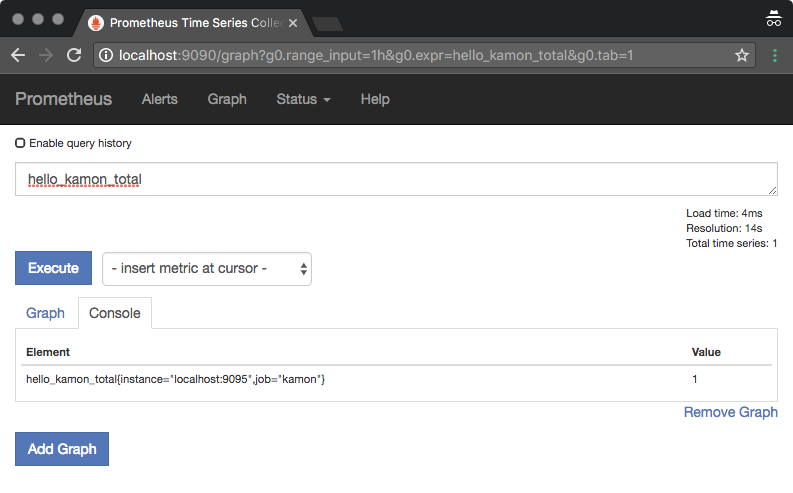
You could also filter for all time series related to the kamon job using {job="kamon"}, which also includes Prometheus's very own metrics (like up reflecting if the target could be scraped).
Prometheus Service Discovery
Later in production, you might want to make use of some service discovery mechanism instead of hardcoding IP addresses. In our case, we are using AWS, from which Prometheus automatically queries all instance details. Instance tags allow to filter (Platform: akka) and copy over meta information (AkkaRole tag) to Prometheus:
- job_name: kamon

 ec2_sd_configs:

 - region: eu-west-1

 port: 9095

 relabel_configs:

 - source_labels: [__meta_ec2_tag_Platform]

 regex: akka # for kamon, we only want Akka instances

 action: keep

 target_label: platform

 - source_labels: [__meta_ec2_tag_AkkaApplication]

 target_label: akka_application

 - source_labels: [__meta_ec2_tag_AkkaRole]

 target_label: akka_role
Custom Metrics
We will now move on to custom metrics, which can be used also with Kamon using plain Java/Scala (without Akka).
Other than the monotonically increasing counter metric seen in the above example, Kamon has few other metric types. Let's review them.
Gauges
Gauges are a rather simple metrics type that allows to track arbitrary numbers (incrementing or decrementing), e.g., the currently active connections to your database. Example:
Kamon.gauge("hello.gauge").increment(43L);

Kamon.gauge("hello.gauge").decrement();
Output:
# TYPE hello_gauge gauge
hello_gauge 42.0
Histograms
Histograms are where the fun part begins. Distributions give us a lot more information compared to a a single value, e.g. an average. In case you are not fully immersed in this topic, we recommend the SRE book and Ivan's talk at ScalaSwarm 2017. It is better to export percentiles rather than averages and histograms are keys to aggregate data from multiple servers. Long story short, let's fill a histogram with 1000 values, ranging from 0 to 999:
Histogram hist = Kamon.histogram("hello.histogram");

for (int i = 0; i < 1000; i++) {

 hist.record(i);

}
Output:
# TYPE hello_histogram histogram
hello_histogram_bucket{le="10.0"} 11.0
hello_histogram_bucket{le="30.0"} 31.0
hello_histogram_bucket{le="100.0"} 101.0
hello_histogram_bucket{le="300.0"} 302.0
hello_histogram_bucket{le="1000.0"} 1000.0
hello_histogram_bucket{le="3000.0"} 1000.0
hello_histogram_bucket{le="10000.0"} 1000.0
hello_histogram_bucket{le="30000.0"} 1000.0
hello_histogram_bucket{le="100000.0"} 1000.0
hello_histogram_bucket{le="+Inf"} 1000.0
hello_histogram_count 1000.0
hello_histogram_sum 498640.0
Magically, Kamon exported 12 results for Prometheus, 10 for the histogram's buckets with their upper bound (le = less equal) as label. We see that in total 11 samples (0-10) are detected in the "<= 10" bucket. Similarly, 1000 in the "<= 1000" bucket, yet only 1000 as well in the "<= 30000", which makes sense, as we have only added values 0 to 999.
Don't worry about it, though! If we want to query the median of the collected data, we can issue the following PromQL query in Prometheus:
histogram_quantile(0.5, hello_histogram_bucket)
The result 498.567335243553 is.. very close to the truth (499.5). In practice, you are likely to experience larger deviation, but aggregation (and thus loss of detail) is the whole point of histograms in comparison to storing raw data. Kamon-prometheus' histograms can also be tuned to better reflect the value space observed in your application. Further, we recommend to read the Prometheus docs to delve into this topic, as well as to understand how to calculate percentiles of changes in histogram contents over time.
Timer
This helper provides a nice way to measure latencies of API calls, database queries, etc.:
StartedTimer t = Kamon.timer("hello.timer").start();

Thread.sleep(333);

t.stop();
Output, well known, and luckily again a histogram:
# TYPE hello_timer_seconds histogram
hello_timer_seconds_bucket{le="0.005"} 0.0
hello_timer_seconds_bucket{le="0.01"} 0.0
hello_timer_seconds_bucket{le="0.025"} 0.0
hello_timer_seconds_bucket{le="0.05"} 0.0
hello_timer_seconds_bucket{le="0.075"} 0.0
hello_timer_seconds_bucket{le="0.1"} 0.0
hello_timer_seconds_bucket{le="0.25"} 0.0
hello_timer_seconds_bucket{le="0.5"} 1.0
hello_timer_seconds_bucket{le="0.75"} 1.0
hello_timer_seconds_bucket{le="1.0"} 1.0
hello_timer_seconds_bucket{le="2.5"} 1.0
hello_timer_seconds_bucket{le="5.0"} 1.0
hello_timer_seconds_bucket{le="7.5"} 1.0
hello_timer_seconds_bucket{le="10.0"} 1.0
hello_timer_seconds_bucket{le="+Inf"} 1.0
hello_timer_seconds_count 1.0
The one sample of 333ms that was recorded fell into the "<= 0.5" seconds bucket. Perfect!
Range Sampler
The Range Sampler is a somewhat "special" metric type probably seen nowhere else in the world. It tracks the minimum and maximum values observed and can be incremented or decremented similar to the gauge. The sampling interval defaults to every 200ms and can further be specified independent of Kamon's (much larger) tick interval.
In many cases, it would be a better alternative to for the gauge. The output when using Prometheus is, again, a histogram containing the observed minimum and maximum values during seen in the past tick interval.
Measurement Units
Above in the description of the Timer, we have seen how Kamon magically picks different histogram buckets compared to the plain histogram. Internally, Kamon supports different MeasurementUnits: none, time and information. The last two are not only available in their base unit, but also in milli/micro/nanoseconds respectively kilo/mega/gigabytes. There is therefore no need to multiply or divide when tracking some transferred data volume:
Kamon.counter("hello.gigabyte", MeasurementUnit.information().gigabytes()).increment();
On the Prometheus endpoint, we will see no trace this shortcut (as Prometheus works with base units):
# TYPE hello_gigabyte_bytes_total counter
hello_gigabyte_bytes_total 1073741824.0
Kamon picks different histogram buckets per measurement unit and selects the time MeasurementUnit when using a Timer.
Tags
To exploit the full capabilities of the Kamon+Prometheus combination (at least regarding custom metrics), we will delve into tags (in Kamon speech) respectively labels (in Prometheus speech).
Imagine we want to track the number of HTTP requests to which our application responds to. We already know by now how to increase a counter, but what if you want to split it up by the status code (200, 404, 503 etc.). In that case, we could use the following code:
Kamon.counter("http.handled.200").increment();

Kamon.counter("http.handled.404").increment();
The result can be stored by Prometheus without complaining:
http_handled_200_total 1.0
http_handled_404_total 1.0
But the above data can be queried only in complete isolation. Summing up all requests regardless of their status code would require you to know all of the possible status codes and add up individual values.
This is where Prometheus labels come into play. The resulting non-hierarchical, but instead multi-dimensional, data model is extremely powerful. Kamon 1.0's internal data structures halso ave undergone severe refactoring to more closely resemble this approach.
To include information about the status code, we can easily refine our counters (same for all other metric types as well) using the refine() method:
Kamon.counter("http.handled").refine("status", "200").increment();

Kamon.counter("http.handled").refine("status", "404").increment();
We can see that, much like the histograms, the http_handled_total metric appears twice, but with different labels:
# TYPE http_handled_total counter
http_handled_total{status="200"} 1.0
http_handled_total{status="404"} 1.0
Inside Prometheus, we are now free to aggregate as much time series as needed:
# all requests
sum(http_handled_total) -> 2
# all requests with status code 2xx
sum(http_handled_total{status=~"2.+"}) -> 1
Multiple tags can be added as well, although it feels a bit clumsy in Java 8:
HashMap<String, String> tags = new HashMap<>();

tags.put("status", "200");

tags.put("method", "GET");

Kamon.counter("http.handled").refine(tags).increment();
Summary & Outlook
This article described the basic setup of Kamon and Prometheus. We extensively looked into how custom metrics help to expose the service level indicators (SLI) of your application. Stay tuned for the next part, where we we will explore how kamon-akka can expose metrics about our actor system. This will finally also provide an opportunity to fire up Grafana for some nice graphs.
We want to thank the Kamon team for their great work and support in the chat room.

emnify
The content team of emnify is specialized in all things IoT. Feel free to reach out to us if you have any question.